| Time | Type | Volume | Symbol | Price | S/L | T/P | Price |
| 2020.06.26 23:00 | Buy | 0.12 | AUDUSD | 0.68621 | 0.68401 | 0.70617 | 0.68631 |
| 2020.06.26 23:00 | Sell | 0.12 | AUDUSD | 0.68592 | 0.68952 | 0.66591 | 0.68678 |
| 2020.06.24 23:00 | Sell | 0.06 | EURUSD | 1.12535 | 1.1247 | 1.10532 | 1.12209 |
| 2020.06.25 08:07 | Sell | 0.09 | EURUSD | 1.12504 | 1.12434 | 1.10504 | 1.12209 |
| 2020.06.26 17:00 | Sell | 0.08 | EURUSD | 1.12063 | 1.12442 | 1.10063 | 1.12209 |
| 2020.06.26 23:00 | Buy | 0.08 | EURUSD | 1.12282 | 1.11894 | 1.1428 | 1.12158 |
| 2020.06.25 08:05 | Sell | 0.09 | GBPUSD | 1.24149 | 1.24149 | 1.23159 | 1.23382 |
| 2020.06.24 23:00 | Sell | 0.03 | GBPUSD | 1.24175 | 1.24175 | 1.23185 | 1.23382 |
| 2020.06.25 17:00 | Sell | 0.07 | GBPUSD | 1.24153 | 1.24153 | 1.23163 | 1.23382 |
| 2020.06.25 23:00 | Sell | 0.11 | GBPUSD | 1.24217 | 1.24217 | 1.23227 | 1.23382 |
| 2020.06.26 23:00 | Sell | 0.11 | USDCAD | 1.36676 | 1.37145 | 1.34675 | 1.36892 |
| 2020.06.26 23:00 | Buy | 0.11 | USDJPY | 107.211 | 106.793 | 109.211 | 107.193 |
| 2020.06.24 23:00 | Sell | 0.08 | XAUUSD | 1 765.96 | 1 779.72 | 1 745.96 | 1 770.48 |
| 2020.06.26 23:00 | Buy | 0.07 | XAUUSD | 1 771.35 | 1 746.96 | 1 791.35 | 1 769.68 |
| 2020.06.26 23:00 | Sell | 0.08 | XAUUSD | 1 770.98 | 1 773.46 | 1 750.98 | 1 770.48 |
| 2020.06.26 23:00 | Buy Limit | 0.04 | AUDUSD | 0.68455 | 0.68401 | 0.70527 | 0.68678 |
| 2020.06.26 23:00 | Buy Limit | 0.13 | AUDUSD | 0.68509 | 0.68401 | 0.70527 | 0.68678 |
| 2020.06.26 23:00 | Sell Limit | 0.13 | AUDUSD | 0.68772 | 0.68952 | 0.66681 | 0.68631 |
| 2020.06.26 23:00 | Buy Limit | 0.09 | EURUSD | 1.12076 | 1.11894 | 1.1419 | 1.12209 |
| 2020.06.26 23:00 | Sell Limit | 0.04 | USDCAD | 1.37028 | 1.37145 | 1.34765 | 1.36842 |
| 2020.06.26 23:00 | Sell Limit | 0.13 | USDCAD | 1.3691 | 1.37145 | 1.34765 | 1.36842 |
| 2020.06.26 23:00 | Buy Limit | 0.04 | USDJPY | 106.898 | 106.793 | 109.121 | 107.244 |
| 2020.06.26 23:00 | Buy Limit | 0.13 | USDJPY | 107.002 | 106.793 | 109.121 | 107.244 |
| 2020.06.26 23:00 | Buy Limit | 0.08 | XAUUSD | 1 758.24 | 1 746.96 | 1 791.32 | 1 770.48 |
| 2020.06.26 23:00 | Sell Limit | 0.09 | XAUUSD | 1 771.56 | 1 773.46 | 1 751.15 | 1 769.68 |


Bump and Run Chart Pattern Strategy
The Bump and Run chart pattern is a remarkable reversal pattern that will help you spot the end of a trend and the beginning of a new one. The Bump and Run trading strategy is a very aggressive market strategy that seeks to capitalize on very fast-moving markets.
Our team at Trading Strategy Guides is working hard to develop the most comprehensive guide on different chart pattern strategies. In order to understand the psychology of a chart pattern, please start here: Chart Pattern Trading Strategy step-by-step Guide.
The Bump and Run chart pattern is part of the same pattern category similar to the Triple Top Chart Pattern.
We favor to run the Bump and Run trading strategy on the lower time frames and preferably the 1-hour chart. After extensive backtesting, we have found that the 1H time frame tends to produce more reliable Bump and Run reversal. Also, read the hidden secrets of moving average.
Now…
Moving forward, we’re going to discuss the attributes of the Bump and Run reversal top and bottom, the angles of the uptrends, as well as the time spans and heights of the Bump and Run chart pattern. Also, read about Trader’s Tech and Installing MT4 EAs with Indicators.
What is Bump and Run Reversal?
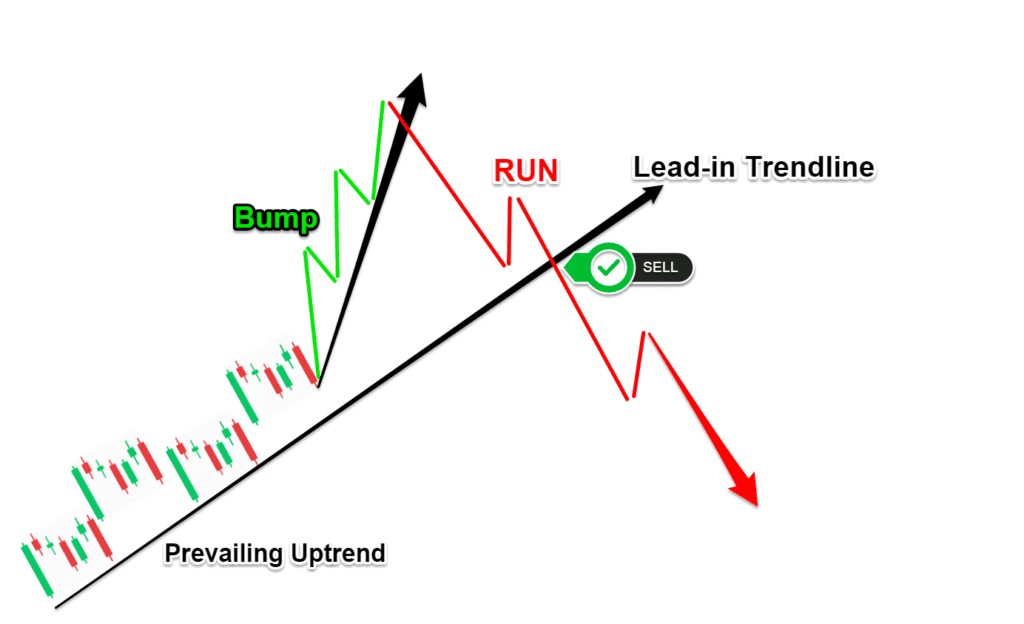
The first portion of the Bump and Run chart pattern represents an uptrend. The swing lows of the uptrend can be connected with a trendline which is referred to as the lead-in trendline.
*Note: During this stage, the price formation of the Bump and Run reversal will move very close to the lead-in trendline.
The second part of the Bump and Run chart pattern is defined by the bump.
The bump is simply an acceleration of the prevailing uptrend. During this section of the Bump and Run reversal, the price will depart from the lead-in trendline and move in a parabolic trajectory. During this stage, you can also draw another trendline connecting the lows created during the Bump move.
Based on the textbook rules a sell signal is triggered when the lead-in trendline is pierced to the downside.
Other observations about the Bump and Run reversal:
- The lead-in trendline angle is supposed to be about 30 to 45 degrees.
- The Bump angle is supposed to be between 45 and 60 degrees.
You don’t need to worry about working the percentage of the angle because for the most part you just need to understand only what the Bump and Run chart pattern formation looks like
The Bump height, which is the difference between the lead-in trendline and the top of the Bump and Run reversal price, should be at least two times the height during the initial stage of the uptrend.
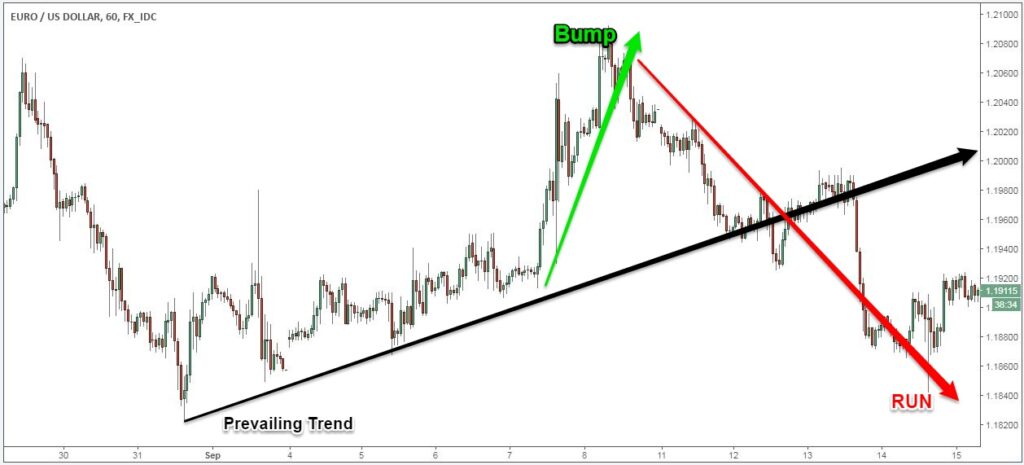
In the figure below, we’ve highlighted a real example of a valid Bump and Run chart pattern:
Now, let’s see how you can effectively trade with the Bump and Run trading strategy and how to make profits from basically using no technical indicator.
Bump and Run Trading Strategy – Sell Rules
The Bump and Run trading strategy is one of the best reversal trading strategies that you’ll probably ever need to learn. The psychological reason why the Bump and Run reversal is such a powerful pattern is because it takes advantage of the result of excessive speculation. This propels the price too swiftly to the extreme which leads to a reversal.
Moving forward, we present the sell-side rules of the Bump and Run trading strategy:
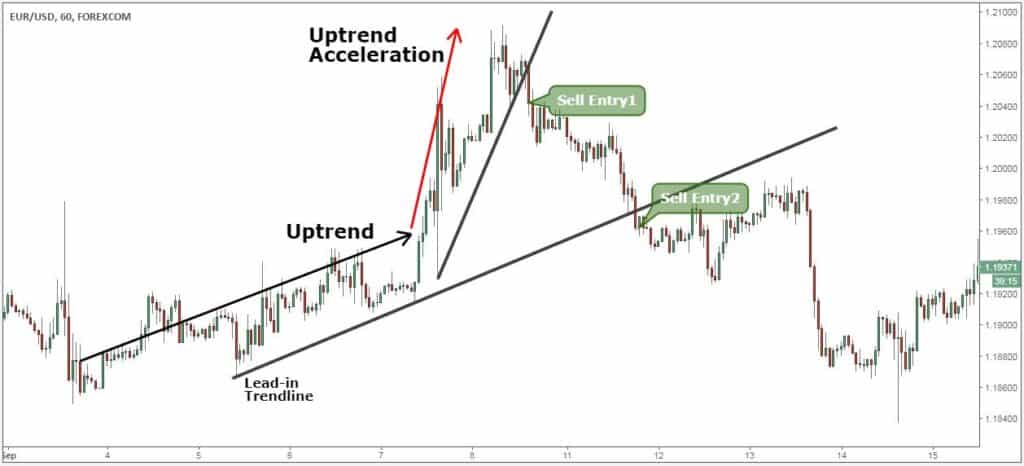
Step #1: Wait until you can identify an uptrend (lead-in) and then an acceleration of that uptrend (Bump)
We’re breaking down the Bump and Run chart pattern into several steps. The first step is to identify an uptrend and then an acceleration of that uptrend. These two components of a trend constitute the first part of the Bump and Run Reversal.
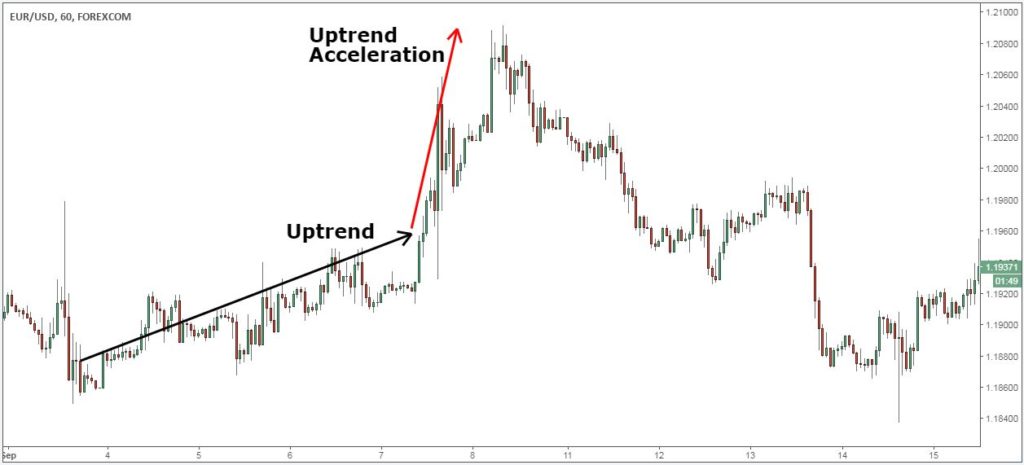
*Note: A valid Bump and Run chart pattern has the first section of the trend drifting upwards very slowly and in the second part of the trend we need to see momentum picking up and the uptrend moving to the extreme.
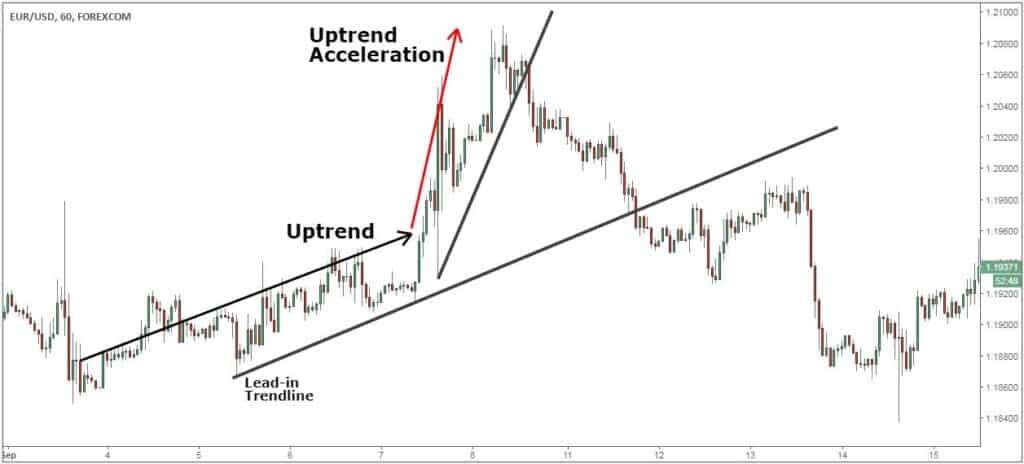
Step #2: Draw the lead-in trendline that connects the lows during the first stage of the trend and draws a second trendline connecting the lows during the uptrend acceleration stage
The way you draw the trendline can be a subjective matter because there are several ways to do it and neither of them is better than the other. Ultimately, it all comes down to your experience and understanding of the price action.
So far, so good.
Now we move to the second component of the Bump and Run chart pattern and the third step of the Bump and Run trading strategy. This is also related to our entry technique.
Step #3: Sell Entry 1 at the break and close below the first Trendline, Sell Entry 2 at the break and close below Lead-in Trendline.
In order to maximize our potential profits we like to implement a two entries technique as follows:
- Sell Entry 1 once the first trendline is broken. For confirmation of a valid breakout, we like to wait for the candle close below the trendline.
- Sell Entry 2 once the Lead-in trendline is broken. Wait for confirmation of a valid breakout we like to wait for the candle close below the trendline
During this stage, the market is in the process of reversal and the “Run” component of the Bump and Run chart pattern is formed.
The Run phase is identified when the price falls and breaks below the Lead-in trendline which also confirms that we’re in the process of reversing the previous trend.
The next logical thing we need to establish for the Bump and Run trading strategy is where to take profits.
See below…
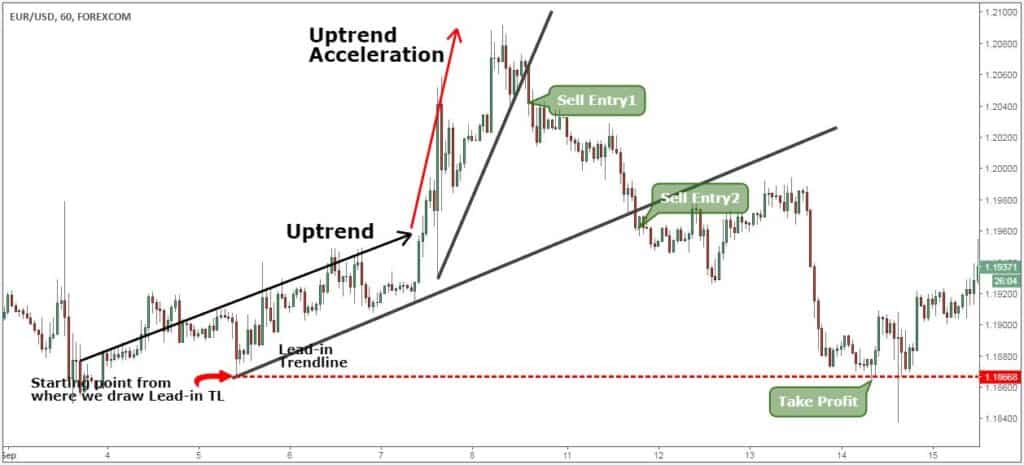
Step #4: Take profit at the Lead-in trendline starting point
The ideal profit target for the Bump and Run trading strategy is at the Lead-in trendline starting point. In other words, take profits at the exact same level you use to draw your Lead-in trendline.
We encourage you to experiment different take profit strategies because the Bump and Run chart pattern can also lead to a severe reversal that can be the starting point of a big bearish trend.
The next important thing we need to establish is where to place your protective stop loss.
See below…
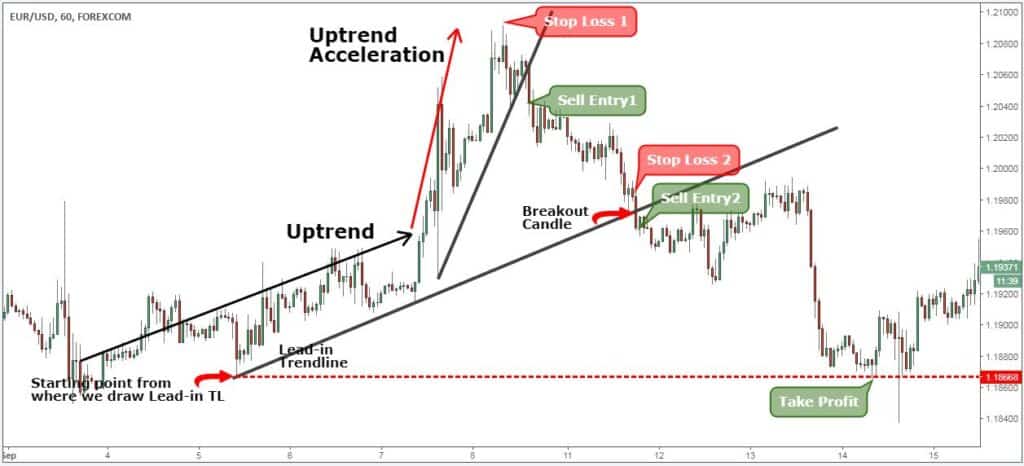
Step #5: Place initial SL above the swing high created by the uptrend acceleration. Second SL placed above the Lead-in trendline breakout candle
Since we’re splitting our trade into two trades, we’re going to have two protective stop losses. The initial stop loss is placed just above the swing high created by the uptrend acceleration phase.
The second protective stop loss is placed above the candle that breaks the Lead-in trendline.
We’re adopting a very conservative approach here because if we truly have a reversal we consider that the market should not look back. In this regard, we keep our SL very tight.
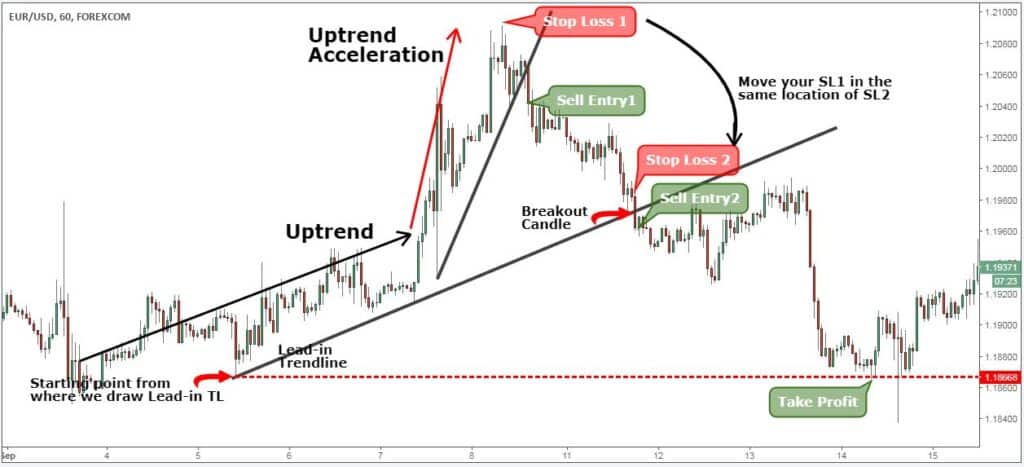
Now…
We also recommend that once your second entry gets triggered to move your initial stop loss in the exact location as the SL2. This will guarantee you that even if you get stopped out on your second entry you’ll still be left with some profits.
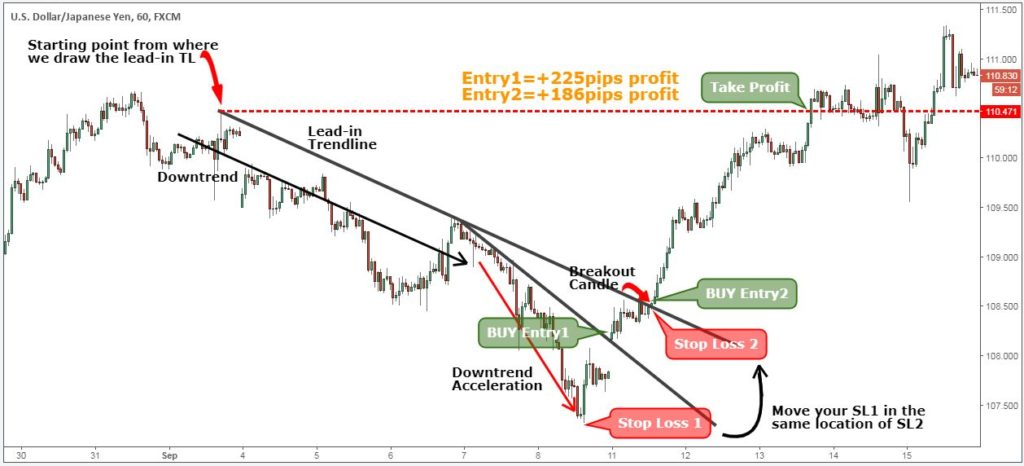
*Note: The above was an example of a SELL trade… Use the same rules – but in reverse – for a BUY trade, but this time we’re going to use the inverse Bump and Run reversal. In the figure below, you can see an actual BUY trade example, using the Bump and Run chart pattern.


No comments:
Post a Comment